SOLUTIONS
Root Cause Analysis
Closing the gap between alerts and answers



Closing the gap between alerts and answers
Alerts fire. Tickets created. Issues validated. Then the MTTI scramble begins – the race to isolate where it happened and identify why.
Without real-time, traffic-level evidence, engineers spend valuable time trying to reproduce transient issues and isolate layers. Server metrics, switch counters, and syslogs aren’t much help – they report state changes, but not what happened in between network components. Such visibility gaps often lead to finger-pointing and days-long war rooms. By the time root cause is confirmed, MTTR and team credibility have both taken a hit.
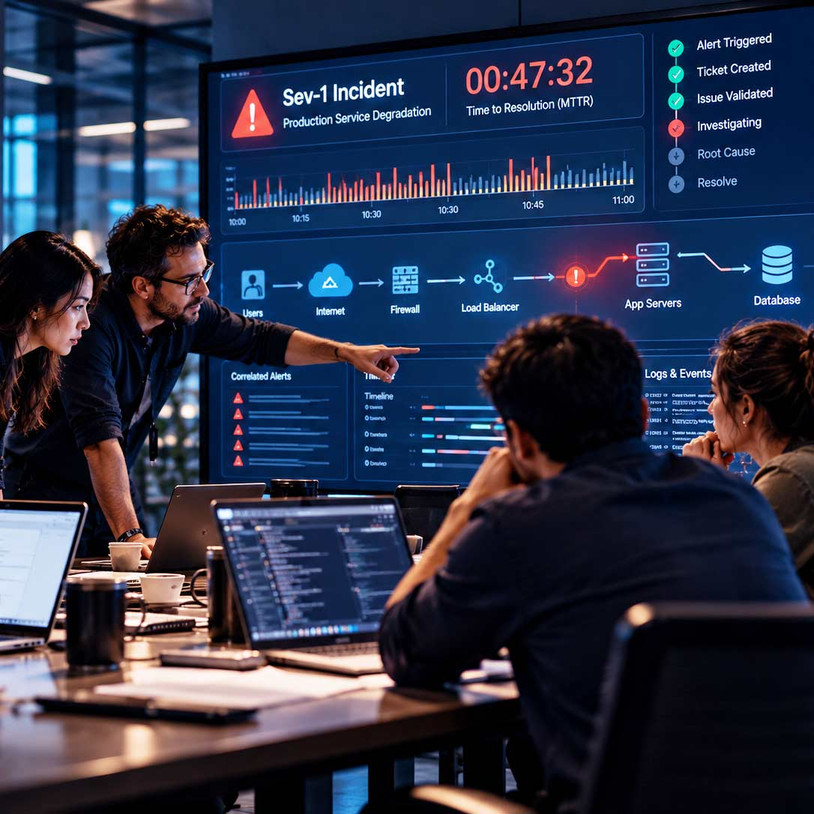



Isolate the failing segment or dependency with session-level evidence instead of cycling through server and network dashboards.

Session metrics show conclusively whether the server, the network path, or an upstream dependency caused the slowdown.

NetOps, SecOps, and app teams work from the same evidence, so incident reviews start with facts and end with trust.

Every finding is grounded in packet evidence, every investigation is traceable, every action is controlled by humans.

cVu packet brokers deliver full-fidelity traffic to cStor packet capture appliances, where it is analyzed, indexed, stored, and turned into session metrics – showing TCP health, latency, error rates, and loss.
When an alert fires, an engineer can use the cClear Control Center to see exactly where performance degrades by comparing historical and real-time metrics across all monitoring points. And when the evidence points to a specific session, they can seamlessly pivot from Grafana dashboards into Wireshark packet details to verify the root cause.
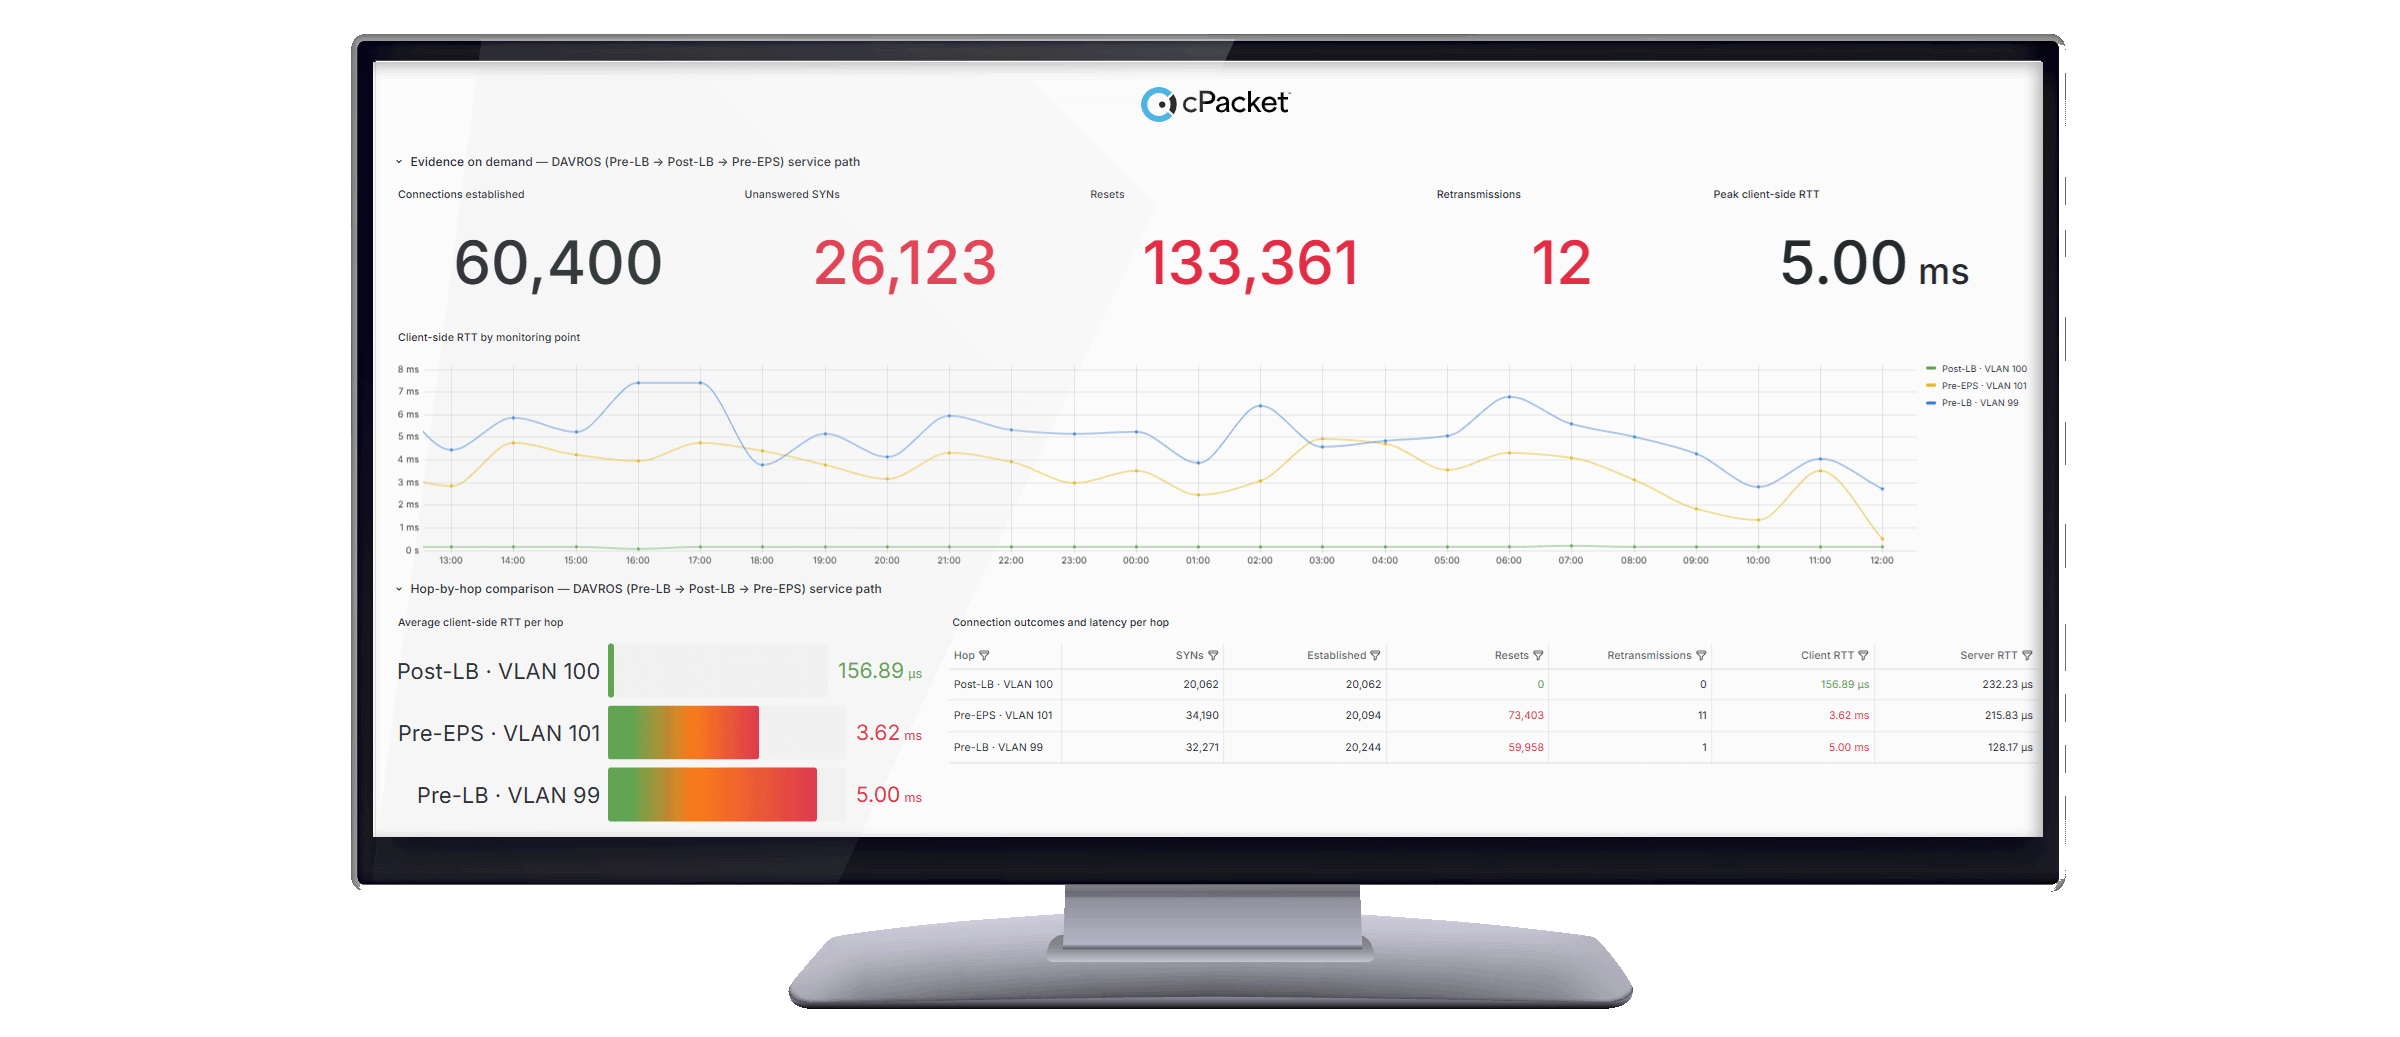


Access and correlate root cause evidence in real-time, rather than reproducing the problem or stitching together disconnected tools after the fact.
Compare RTT, retransmissions, and connection outcomes across network locations to isolate the exact segment experiencing a slowdown or failure.
Pull the exact packets behind a flagged session in seconds, even across a multi-cStor estate, to confirm root cause with evidence.
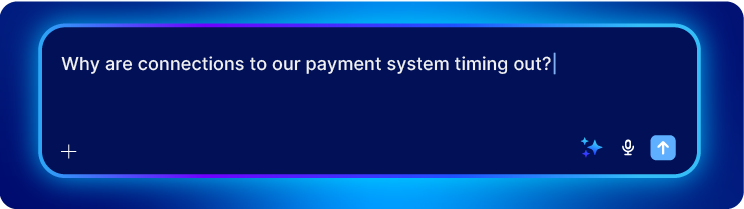
cPacket AI helps operators investigate and pinpoint degraded segment faster than building a dashboard query by hand. The AI layer queries the same session metrics and follows the same troubleshooting methods that expert engineers use to reveal potential root causes and suggest next steps. These suggestions can be checked against evidence the team already trusts.

Apply the same investigation steps without manual dashboard correlation, so results are verifiable and repeatable.
Expose curated queries instead of raw schemas, ruling out destructive or overly broad requests and keeping answers fast and accurate.
AI-guided workflows suggest root cause and next steps, but engineers own every decision and action.
Get answers to common questions about network observability and cPacket solutions.
Log-based tools depend on what each component chooses to report about itself. cPacket's session metrics come from the packets themselves, captured without loss and independent of any single device's own reporting — which is what catches failures that live between components rather than inside one.
No. cPacket acquisition is predominantly agentless, using optical taps, SPAN/RSPAN, or cloud-native mirroring, so root-cause investigation doesn't require new instrumentation on every host or application.
cStor keeps lossless capture and session metrics locally for hours to months, depending on your requirements, and pushes session metrics to your own object store (S3, Azure Blob, or GCS) as Parquet for longer-horizon investigation.
AI-guided workflows suggest root cause and next steps, but engineers own every decision and action.
Our team of experts can work with you to align your network strategy to cPacket’s industry-leading packet broker and capture solutions.