SOLUTIONS
Container Visibility
See the pod-to-pod traffic that most observability tools miss



See the pod-to-pod traffic that most observability tools miss
Application and DevOps teams look to Kubernetes and Docker to accelerate deployment and scale on demand. In today’s data centers, most traffic moves east-west between containerized workloads – much of it never leaving the host on which it runs. This creates significant visibility gaps for network and security teams.
When a containerized app slows down, NetOps gets the ticket, but has little visibility inside the cluster. They must map IPs and interfaces to pods and namespaces. Every container network interface (CNI) across AWS, Azure, and Google Cloud adds another layer. Triage slows, outages run longer, and lateral movement between workloads goes unverified.




Packet evidence between containers takes teams from symptom to root cause sooner, shortening MTTR for incidents with containerized applications.

Full-fidelity capture lets SecOps validate alerts, trace lateral movement between workloads, and reconstruct incidents with complete context.

Each downstream tool receives only the container traffic it needs, reducing processing load and capture storage without giving up visibility.

Both teams work from the same packet record across Kubernetes and Docker, ending debates over whose data is right.

cTap-V is cPacket's virtual tap – built on eBPF (Extended Berkeley Packet Filter) and running on each Kubernetes node or Docker host. cTap-V mirrors pod and container traffic from the Linux kernel, including east-west traffic that never leaves the host. cTap-V filters that traffic by namespace, label, pod, or 5-tuple and forwards it to cStor-V virtual appliances for packet capture and analytics, or to cVu-V virtual packet brokers for replication to NDR, NPM, and forensics tools. Engineers then analyze session KPIs and retrieve packets in cClear-V Control Center – the same capture-and-analytics pipeline cPacket runs on physical and cloud networks, extended inside the cluster.



Runs as a Kubernetes DaemonSet or Docker Compose container, capturing pod and container traffic in the kernel without sidecars, pod restarts, or application changes.
Positions ahead of Cilium in the TCX program chain, copies each packet, and returns it unchanged, so Cilium clusters gain full visibility without altered traffic.
Filters by namespace, label, service name, or 5-tuple, giving each NDR, NPM, or forensics tool a tailored feed that cuts tool load and storage.
An engineer asks a question scoped to a service and time window, and cPacket's purpose-built MCP servers query session metrics in cClear-V and cStor-V. Skills guide the analysis with tested troubleshooting methodology, and targeted packet retrieval confirms the finding.
cPacket AI handles detection and analysis using packet-derived evidence from inside the cluster, while remediation decisions stay with your team.
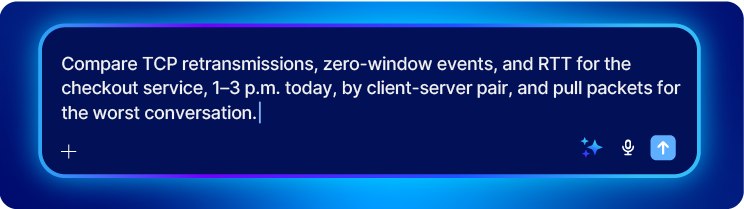

Engineers ask about a service, time window, and breakout – such as TCP retransmissions by client – and get answers drawn from packet-derived session metrics.
Skill packs encode how senior engineers troubleshoot, so investigations follow consistent, tested query patterns that reduce the risk of hallucinated answers.
MCP servers connect cPacket data to the AI clients and orchestration platforms your team already runs, alongside other MCP-enabled tools such as ticketing.
Get answers to common questions about network observability and cPacket solutions.
Pods on the same node communicate through virtual interfaces and the Linux kernel, so that traffic never reaches a physical NIC, switch or cloud mirroring points where network monitoring tools can see it. cPacket's cTap-V acquires traffic at the node, in the kernel, where every pod-to-pod conversation passes, so intra-node traffic becomes as visible as traffic on the physical network.
Taps and SPAN ports see traffic that crosses the physical network between nodes, but they miss traffic that stays on a node. cPacket treats node-level acquisition as an addition to existing taps, not a replacement. cTap-V covers traffic inside the node, while optical taps and SPAN feed cVu packet brokers, and both sources flow into the same cPacket capture and analytics pipeline.
Running tcpdump inside a pod works for quick check – but it doesn't scale and misses events that already happened, and it often means changing the workload. cPacket captures continuously at the node instead. cTap-V mirrors traffic to cStor-V, which records packets and computes session analytics in the same system, so evidence already exists when an incident begins.
It depends on where capture runs. Sidecars run inside every application pod and compete with the workload for CPU and memory. cTap-V runs once per node as a DaemonSet and uses eBPF to keep the capture path out of application pods entirely. It needs no sidecars, pod restarts or changes to application containers.
Application logs report errors and response times, but they can't show what happened on the connection between services. Packet-derived metrics can: they separate network RTT from server response time and expose retransmissions and zero-window events. cPacket computes these metrics from the packets cTap-V captures. Engineers can then see whether the delay sits in the network or the application, and retrieve the packets to prove it.
Our team of experts can work with you to align your network strategy to cPacket’s industry-leading packet broker and capture solutions.