SOLUTIONS
Microburst Detection & Analysis
See the millisecond bursts that hide in one-second averages



See the millisecond bursts that hide in one-second averages
In demanding environments, such as stock exchanges and high-frequency trading, milliseconds matter. Even the slightest delay can have significant consequences – application slowdowns, intermittent retransmissions, unexpected latency, and security vulnerabilities.
Microbursts are commonly to blame. These high-intensity spikes last just milliseconds, but can overload switch buffers and cause packet loss. At 100G, a link carries 12.5 MB every millisecond – enough to exhaust a shallow buffer before anyone notices.




Meet service-level commitments by catching the hidden bursts that erode application and cloud service performance.

Reduce the lost transactions and service degradations that cost revenue and push customers toward other providers.

Lower the risk of service outages from short-lived, burst-based DDoS traffic that can overwhelm firewalls and IDS/IPS before they react.

Align costly WAN and uplink expansions to the peaks your traffic actually produces, instead of averages that understate demand.

cVu packet brokers run cBurst analytics on every monitored link – detecting peaks, attributing its source, and measuring its duration to judge severity. Teams then use cClear Control Center with Grafana dashboards to identify the actual traffic peaks, so they can rebalance streams, tune QoS, or add capacity where it’s needed.
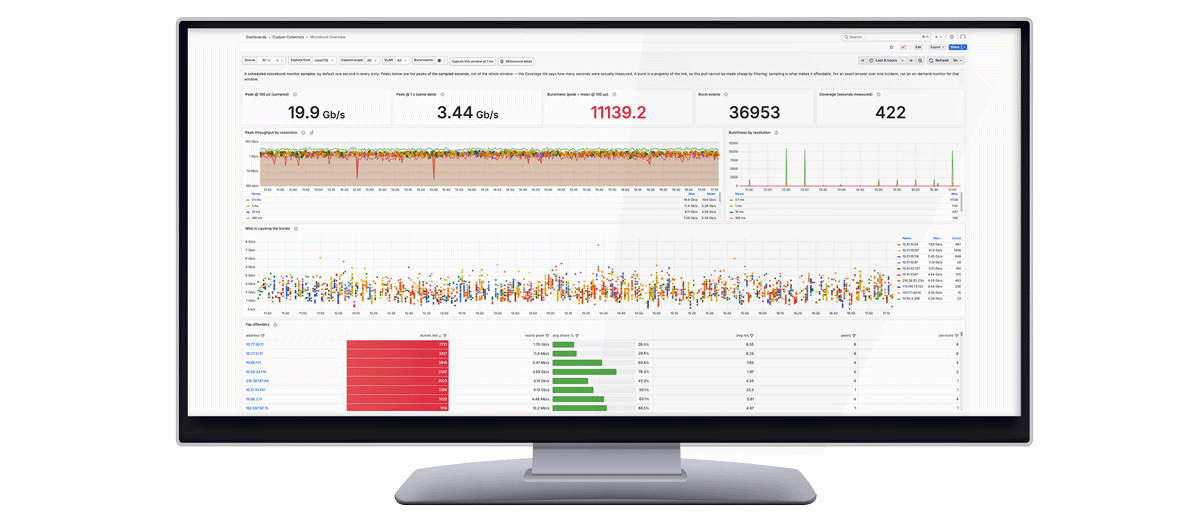


cBurst analytics pinpoint which client, server or workload caused each burst and how many milliseconds it exceeded the threshold, so teams can fix the real cause.
Helps teams correlate bursts with the drops and latency spikes they cause, using hardware timestamps on every packet with nanosecond accuracy.
cClear dashboards show peak millisecond throughput alongside one-second averages, and Grafana notifies operators when bursts exceed utilization thresholds.
The AI client accesses millisecond-level measurements and utilization data through MCP servers, and correlates it using built-in skills. It then returns a report showing where bursts originate, which clients they affect, and how much risk they pose. While detection and analysis are automated, remediation decisions stay with your team.



Ask a question and get an analysis of burst locations, durations, and affected clients without writing queries or navigating dashboards.
cPacket MCP servers give AI clients direct access to millisecond burst and utilization metrics, so answers rest on wire data rather than averaged counters.
The AI compiles findings into a report that identifies burst sources, affected clients, and overall network impact for engineering and leadership review.
Get answers to common questions about network observability and cPacket solutions.
Microbursts are sudden, high-intensity spikes in network traffic that last just milliseconds. Without millisecond-resolution network observability tools, microbursts are invisible to most network operations teams.
Although they are sporadic and short-lived, microbursts can disrupt application performance, cause security vulnerabilities, and create network blind spots. If left undetected over time, microbursts can lead to significant issues for service reliability, customer experience, and revenue.
cVu NG/NGE packet brokers measure bursts at 1ms resolution, and cVu AG measures at 10ms. The underlying packet timestamps are accurate to nanoseconds – within 30ns at 95% confidence with a PPS reference on cVu NG/NGE.
cPacket makes it easy to identify the cause and duration of microbursts. Its unique cBurst filter, analyze, and attribute each burst to a specific client, server, or workload.
SNMP typically polls every 30 seconds or longer and averages throughput across the interval, so a 10ms burst to line rate disappears. Switch buffer counters can indicate that a burst occurred, but not which traffic caused it or how long it lasted.
The cPacket Control Center (known as cClear) exposes metrics through REST APIs and a documented metrics database schema, so teams can feed burst and utilization data into broader corporate dashboards.
Our team of experts can work with you to align your network strategy to cPacket’s industry-leading packet broker and capture solutions.